If you’ve worked with vRealize Automation (vRA) for any amount of time you’ve most likely experienced a provision that has either failed or gotten stuck in progress. I’m going to show how you can begin troubleshooting these scenarios.
Before we get started I want to say that vRA is one of VMware’s more complicated products. Please don’t download it and start clicking around expect everything to go well. I highly suggest reading at least the following the docs:
Most issues that I see around failed provisioning are due to unsupported and/or misconfigured vRA configurations. For example, please don’t bypass using a proper load balancer and use DNS load balancing instead. This isn’t supported, doesn’t work and doesn’t make any sense.
I’m going to start by showing how to troubleshoot provisioning through log files, but I usually start viewing the provision in the vRA UI. The reason I’m doing this is that tracking a provision through the log files will give you a better understanding how the vRA stack works. I’ll save the UI for last.
All testing was done with vRA 7.2
Context Id
Each provisioning request generates an ID called the Context id. This id is used to track the provision throughout its lifecycle and throughout all components of the vRA stack. This means we can track the provisioning request through the vRA appliances, IaaS servers and vRealize Orchestrator.
When you request a new catalog item, the first log entry you will find will have ConsumerRequestController in it and will look like the following:
2017-04-29 14:42:29,272 vcac: [component=”cafe:catalog” priority=”INFO” thread=”tomcat-http–20″ tenant=”vsphere.local” context=”0avPNFHI” parent=”” token=”0avPNFHI”] com.vmware.vcac.catal
og.controller.consumer.ConsumerRequestController.create:89 – Processing request: CatalogItemRequest [catalogItem={[CatalogItem]: Id: [f97bd696-b57d-436e-8333-a9a352ef9a2e]}, toString()=Req
uest [requestNumber=null, state=SUBMITTED, requestedFor=cloudadmin@vmware.local, requestedBy=null, description=null, reasons=null, organization=Organization[tenant=Tenant [id=vsphere.local
, name=vsphere.local],subTenant=SubTenant [id=0a77da7a-78ed-4eda-9772-3279d73443a3, name=admins, tenant=Tenant [id=vsphere.local, name=vsphere.local]]], requestorEntitlement=null, provider
Binding=null, requestData=LiteralMap[values={requestedFor=cloudadmin@vmware.local, description=null, reasons=null}], getId()=null]]
You can see the context id highlighted as 0avPNFHI.
I’ve created a command that will wait for a provision to take place and immediately highlight and display all entries of the request. You can ssh into the vRA appliances, paste it in and then initiate a new provisioning request in vRA:
echo “Waiting for provision…” && tail -F /var/log/vmware/vcac/catalina.out | grep –color=always $(tail -F /var/log/vmware/vcac/catalina.out | grep -m 1 ConsumerRequestController | cut -d ‘ ‘ -f 8 | cut -d ‘=’ -f 2 | cut -d ‘”‘ -f 2)
Here is what it looks like in action (Larger Image):
Now we have our context id, but where can we find it in the log files? One way to do this is to generate a vRA log bundle, which will reach out to all components in the stack and gather their logs, and then we can recursively search through the log bundle for our context id. To generate a log bundle, go to https://vra-address:5480 > vRA Settings > Cluster > Create Support Bundle and download it.
Once it’s finished I copied it back to the the vRA appliance and ran:
- mkdir vra-provision-logs
- unzip vcac-20170429150906.zip -d vra-provision-logs
- for file in vra-provision-logs/*.zip; do zipgrep -l “0avPNFHI” ${file}; done | sort
This produced the following, which means that our context id 0avPNFHI appears in each the following log files:
Default Web Site/Program Files (x86)/VMware/vCAC/Server/Model Manager Web/Logs/38659b8d-4dc8-4c6a-98ac-dac73738e2fdRepository.log
Default Web Site/Program Files (x86)/VMware/vCAC/Server/Model Manager Web/Logs/Repository.log
ManagerService/Program Files (x86)/VMware/vCAC/Server/Logs/All.log
vc6d.vmware.local/Program Files (x86)/VMware/vCAC/Agents/vc6d.vmware.local/logs/vSphereAgent.log
vcacsupport-2017-04-29_14-58-55.25303/tmp/ps-auwwx.25303.txt
vcacsupport-2017-04-29_14-58-55.25303/var/log/vmware/vcac/catalina.out
vcacsupport-2017-04-29_14-58-55.25303/var/log/vmware/vco/app-server/integration-scripting.log
vcacsupport-2017-04-29_14-58-55.25303/var/log/vmware/vco/app-server/integration-server.log
vcacsupport-2017-04-29_14-58-55.25303/var/log/vmware/vco/app-server/scripting.log
vcacsupport-2017-04-29_14-58-55.25303/var/log/vmware/vco/app-server/server.log
vcacsupport-2017-04-29_14-58-55.6697/var/log/vmware/vcac/catalina.out
vcacsupport-2017-04-29_14-58-55.6697/var/log/vmware/vco/app-server/integration-scripting.log
vcacsupport-2017-04-29_14-58-55.6697/var/log/vmware/vco/app-server/integration-server.log
vcacsupport-2017-04-29_14-58-55.6697/var/log/vmware/vco/app-server/scripting.log
vcacsupport-2017-04-29_14-58-55.6697/var/log/vmware/vco/app-server/scripting.log_lucene/_qo.fdt
vcacsupport-2017-04-29_14-58-55.6697/var/log/vmware/vco/app-server/server.log
Brief overview of the log files
catalina.out
This is the main log file for the vRA appliance. Since all vRA’s server activity is logged here, we often need to filter based off of the context id or you’ll get overwhelmed with information.
All.log
This log contains everything about the provisioning from the IaaS perspective. You can see entries for such things as RabbitMQ message bus item delivery and receiving, what vRO workflows are ran at each stage of the provisioning process, etc.
vSphereAgent.log
In this example I’m provisioning to a vSphere endpoint so all information regarding the request will be logged here. This log also contains information regarding data collections. If you see something in the vRA interface that doesn’t align with something in vCenter, you can look at this log to see how the vSphere agent is reporting data from vCenter.
scripting.log / server.log
If you’re provision interacts with vRO at any point, you’ll see entries in these logs. This can be extremely helpful to see what inputs your vRO workflows are receiving from vRA and the results of the workflow runs.
Repository.log
The Repository service is provided by IIS and is responsible for (don’t quote me on this) updating modeling information in the MSSQL dabase. Modeling information includes information regarding the type of object that you’re inserting into the database. This includes things like is it a vSphere machine, how many CPUs, memory, etc.
By utilizing the Context id and the log files above, you can track your provisioning and see where it failed or just learn more about the provisioning process in general.
RabbitMQ
RabbitMQ can be thought of as the backbone of the vRA stack. Most components in the stack will drop and retrieve message from the RabbitMQ message bus. Let’s prove how important RabbitMQ is by stopping the service. First we can see that vRA is reporting as healthy:

Now I’m going to stop the RabbitMQ service on both of the vRA appliance nodes:
service rabbitmq-server stop
uh oh:
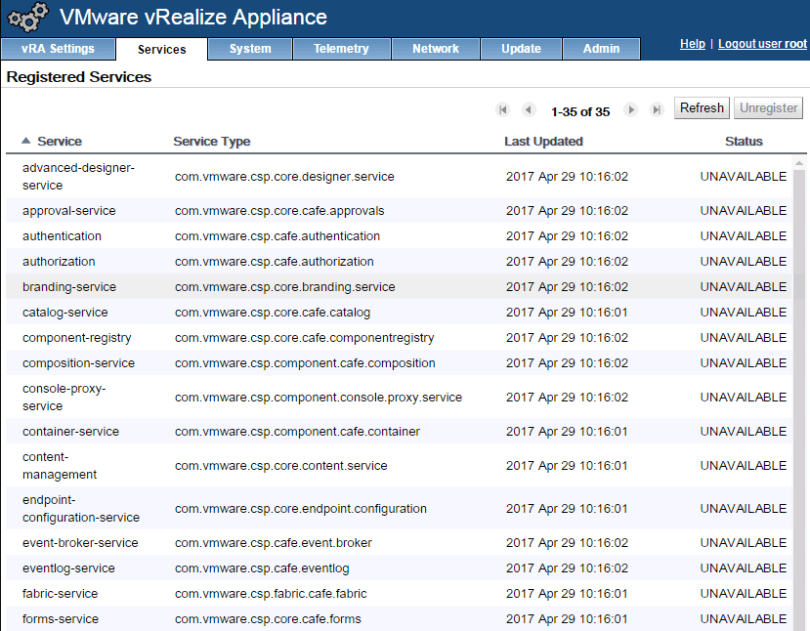
I started RabbitMQ up for the rest of the post.
Here is how we can check the RabbitMQ cluster status:
vra72a:~ # rabbitmqctl cluster_status
Cluster status of node rabbit@vra72a …
[{nodes,[{disc,[rabbit@vra72a,rabbit@vra72b]}]},
{running_nodes,[rabbit@vra72b,rabbit@vra72a]},
{cluster_name,<<“rabbit@vra72a.vmware.local”>>},
{partitions,[]},
{alarms,[{rabbit@vra72b,[]},{rabbit@vra72a,[]}]}]
On this line:
[{nodes,[{disc,[rabbit@vra72a,rabbit@vra72b]}]},
we can see that there are two nodes in the cluster.
On the next line:
{running_nodes,[rabbit@vra72b,rabbit@vra72a]},
we can see that both nodes in the cluster are running.
Many times when provisionings aren’t working it’s because both nodes in the cluster are not running and there is a partition. If this is the case, in the output above you will see only a single vRA appliance node listed as running.
Going into RabbitMQ troubleshooting could be a post of its own, but if one node isn’t listed as running you can try to restart it by running:
service rabbitmq-service restart
If a vRA node is missing from the nodes line, it’s often easiest/quickest to go into the vRA VAMI page (https://vra-appliance:5480) on the lead node and reset RabbitMQ under vRA Settings > Messaging and then join the missing vRA node back to the vRA cluster by going to the VAMI on the bad node and then vRA Settings > Cluster > Enter the leading nodes address and then Join Cluster.
Also, notice how the node names don’t list the FQDN but use the short name instead. RabbitMQ will have problems if short name DNS resolution isn’t resolving. There is a way to enable FQDN instead of short names, but I’m not sure if it’s supported in a vRA deployment.
We can list all RabbitMQ queues by running:
rabbitmqctl list_queues
There are lot of queues so if you’re wanting to know if a message is stuck on a queue, you can grab all queues with an item:
rabbitmqctl list_queues | cut -d$’\t’ -f 2 | grep -v 0
If you find items on a queue for a while, it doesn’t necessarily mean there a problem, but you want to make sure that all vRA appliance nodes are reporting the same information. For example, you could run:
rabbitmqctl list_queues | cut -d$’\t’ -f 2 | grep -v 0 | wc -l
To list the number of queues with items on them on both vRA appliances and make sure they match.
During a provision you can watch as queues get placed on queues and removed with the following command:
while [ 1 ]; do date=$(date); rabbitmqctl list_queues | awk ‘/\t[^0]$/ { print strftime(“%Y-%m-%d-%l:%M:%S”), $0 }’; sleep .5; done
Throughout the provisioning process you’ll see a lot of entries from the command above and you can learn quite a bit about what vRA is doing throughout the provision.
vRO Workflows
Another cause of provisioning failures can be that vRO workflows are stuck or have failed. These workflows can be kicked off via the Event Broker Service (EBS) or through workflow stubs. In my lab I currently have one EBS subscription that messages me on Slack when a provisioning request is completed:

In the vRO client we can see the results of workflow runs:

Monitoring Provisions in the vRA UI
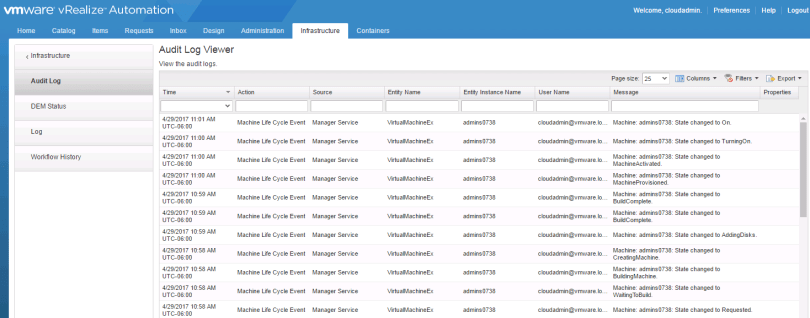
The Audit Log is the first place I usually go to see the state of a provision. You can find it under Infrastructure > Monitoring > Audit Log:
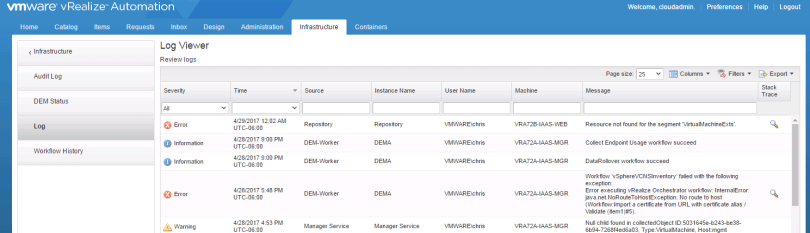
Under Monitoring you will also find Log, which will show you things like vRO workflow failures:
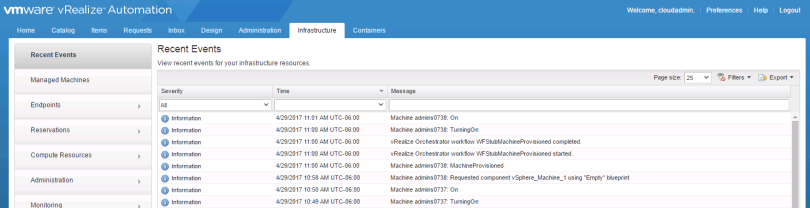
Recent Events under the Infrastructure tab is also useful: