I’ve been studying for the Certified Kubernetes Administrator exam and sometimes use kubeadm to spin up Kubernetes clusters. I wanted to look at the Kubernetes dashboard and found it wasn’t as easy as I hoped to get up and running. I’m going to describe how I was able to get it working. I’m using Kubernetes 1.9 and Calico as the overlay network.
Installing the Dashboard
My cluster is containers three nodes:
[root@admins73603 ~]# kubectl get nodes
NAME STATUS ROLES AGE VERSION
admins73603 Ready master 16d v1.9.0
admins73604 Ready none   16d v1.9.0
admins73605 Ready none   16d v1.9.0
admins73603 is the master and admins73604 and admins73605 are my worker nodes.
I started off by installing the dashboard by running:
kubectl apply -f https://raw.githubusercontent.com/kubernetes/dashboard/master/src/deploy/recommended/kubernetes-dashboard.yaml
Here you can see (last line) that the dashboard is running on node admins73604
[root@admins73603 ~]# kubectl get pods -o wide --all-namespaces
NAMESPACE NAME READY STATUS RESTARTS AGE IP NODE
kube-system calico-etcd-42972 1/1 Running 0 16d 192.168.73.27 admins73603
kube-system calico-kube-controllers-d669cc78f-szxd8 1/1 Running 0 16d 192.168.73.27 admins73603
kube-system calico-node-7wfb2 2/2 Running 1 16d 192.168.73.27 admins73603
kube-system calico-node-8r4tv 2/2 Running 0 13d 192.168.73.22 admins73605
kube-system calico-node-qxb5g 2/2 Running 1 5d 192.168.73.28 admins73604
kube-system etcd-admins73603 1/1 Running 0 16d 192.168.73.27 admins73603
kube-system kube-apiserver-admins73603 1/1 Running 0 16d 192.168.73.27 admins73603
kube-system kube-controller-manager-admins73603 1/1 Running 0 16d 192.168.73.27 admins73603
kube-system kube-dns-6f4fd4bdf-dwjrf 2/3 CrashLoopBackOff 305 13h 192.168.141.164 admins73605
kube-system kube-dns-6f4fd4bdf-fjk29 2/3 CrashLoopBackOff 304 13h 192.168.2.240 admins73604
kube-system kube-proxy-94gdf 1/1 Running 0 5d 192.168.73.28 admins73604
kube-system kube-proxy-s5tj5 1/1 Running 0 16d 192.168.73.27 admins73603
kube-system kube-proxy-w4nqs 1/1 Running 0 13d 192.168.73.22 admins73605
kube-system kube-scheduler-admins73603 1/1 Running 0 16d 192.168.73.27 admins73603
kube-system kubernetes-dashboard-5bd6f767c7-6mlk4 0/1 CrashLoopBackOff 2 2m 192.168.2.242 admins73604
Uh oh, if you look at the last line, you can see that the dashboard pod is in a crash loop backoff.
Looking at the logs for the pod I see that it can’t reach the Kubernetes API server:
[root@admins73603 ~]# kubectl logs kubernetes-dashboard-5bd6f767c7-6mlk4 -n kube-system
2018/03/15 04:14:05 Starting overwatch
2018/03/15 04:14:05 Using in-cluster config to connect to apiserver
2018/03/15 04:14:05 Using service account token for csrf signing
2018/03/15 04:14:05 No request provided. Skipping authorization
2018/03/15 04:14:35 Error while initializing connection to Kubernetes apiserver. This most likely means that the cluster is misconfigured (e.g., it has invalid apiserver certificates or service accounts configuration) or the --apiserver-host param points to a server that does not exist. Reason: Get https://10.96.0.1:443/version: dial tcp 10.96.0.1:443: i/o timeout
Refer to our FAQ and wiki pages for more information: https://github.com/kubernetes/dashboard/wiki/FAQ
By describing the dashboard pod, you can see that it’s failing it’s Liveness probe and being restarted:
kubectl describe kubernetes-dashboard-5bd6f767c7-6mlk4 -n kube-system
...
Events:
 Type Reason Age From Message
 ---- ------ ---- ---- -------
 Normal Scheduled 10m default-scheduler Successfully assigned kubernetes-dashboard-5bd6f767c7-6mlk4 to admins73604
 Normal SuccessfulMountVolume 10m kubelet, admins73604 MountVolume.SetUp succeeded for volume "tmp-volume"
 Normal SuccessfulMountVolume 10m kubelet, admins73604 MountVolume.SetUp succeeded for volume "kubernetes-dashboard-certs"
 Normal SuccessfulMountVolume 10m kubelet, admins73604 MountVolume.SetUp succeeded for volume "kubernetes-dashboard-token-jsdkb"
 Normal Pulling 10m kubelet, admins73604 pulling image "k8s.gcr.io/kubernetes-dashboard-amd64:v1.8.3"
 Normal Pulled 10m kubelet, admins73604 Successfully pulled image "k8s.gcr.io/kubernetes-dashboard-amd64:v1.8.3"
 Warning Unhealthy 9m kubelet, admins73604 Liveness probe failed: Get https://192.168.2.242:8443/: dial tcp 192.168.2.242:8443: getsockopt: connection refused
 Normal Pulled 7m (x3 over 9m) kubelet, admins73604 Container image "k8s.gcr.io/kubernetes-dashboard-amd64:v1.8.3" already present on machine
 Normal Created 7m (x4 over 10m) kubelet, admins73604 Created container
 Normal Started 7m (x4 over 10m) kubelet, admins73604 Started container
 Warning BackOff 18s (x33 over 9m) kubelet, admins73604 Back-off restarting failed container
I decided to place the dashboard pod on the same node as the API server to see if that would make a difference. First I downloaded the dashboard yaml:
curl -LO https://raw.githubusercontent.com/kubernetes/dashboard/master/src/deploy/recommended/kubernetes-dashboard.yaml
You can do this other ways, but I just decided to put a label on my master node named dashboard with a value of true:
kubectl label node admins73603 dashboard=true
In the dashboard yaml file, I added a nodeSelector entry in the container’s spec:
...
 # Comment the following tolerations if Dashboard must not be deployed on master
 tolerations:
 - key: node-role.kubernetes.io/master
 effect: NoSchedule
 nodeSelector:
 dashboard: "true"
Then created the dashboard again using the locally modified yaml file:
kubectl create -f kubernetes-dashboard.yaml
Now my dashboard pod is running on my master (last line):
[root@admins73603 ~]# kubectl get pods -o wide -n kube-system
NAME READY STATUS RESTARTS AGE IP NODE
calico-etcd-42972 1/1 Running 0 16d 192.168.73.27 admins73603
calico-kube-controllers-d669cc78f-szxd8 1/1 Running 0 16d 192.168.73.27 admins73603
calico-node-7wfb2 2/2 Running 1 16d 192.168.73.27 admins73603
calico-node-8r4tv 2/2 Running 0 13d 192.168.73.22 admins73605
calico-node-qxb5g 2/2 Running 1 5d 192.168.73.28 admins73604
etcd-admins73603 1/1 Running 0 16d 192.168.73.27 admins73603
kube-apiserver-admins73603 1/1 Running 0 16d 192.168.73.27 admins73603
kube-controller-manager-admins73603 1/1 Running 0 16d 192.168.73.27 admins73603
kube-dns-6f4fd4bdf-dwjrf 1/3 CrashLoopBackOff 313 13h 192.168.141.164 admins73605
kube-dns-6f4fd4bdf-fjk29 2/3 CrashLoopBackOff 313 13h 192.168.2.240 admins73604
kube-proxy-94gdf 1/1 Running 0 5d 192.168.73.28 admins73604
kube-proxy-s5tj5 1/1 Running 0 16d 192.168.73.27 admins73603
kube-proxy-w4nqs 1/1 Running 0 13d 192.168.73.22 admins73605
kube-scheduler-admins73603 1/1 Running 0 16d 192.168.73.27 admins73603
kubernetes-dashboard-86c85cf79b-7446r 1/1 Running 0 11s 192.168.21.197 admins73603
It works:
[root@admins73603 ~]# kubectl logs kubernetes-dashboard-86c85cf79b-7446r -n kube-system
2018/03/15 04:39:36 Using in-cluster config to connect to apiserver
2018/03/15 04:39:36 Starting overwatch
2018/03/15 04:39:36 Using service account token for csrf signing
2018/03/15 04:39:36 No request provided. Skipping authorization
2018/03/15 04:39:36 Successful initial request to the apiserver, version: v1.9.0
2018/03/15 04:39:36 Generating JWE encryption key
2018/03/15 04:39:36 New synchronizer has been registered: kubernetes-dashboard-key-holder-kube-system. Starting
2018/03/15 04:39:36 Starting secret synchronizer for kubernetes-dashboard-key-holder in namespace kube-system
2018/03/15 04:39:37 Initializing JWE encryption key from synchronized object
2018/03/15 04:39:37 Creating in-cluster Heapster client
2018/03/15 04:39:37 Auto-generating certificates
2018/03/15 04:39:37 Metric client health check failed: the server could not find the requested resource (get services heapster). Retrying in 30 seconds.
2018/03/15 04:39:37 Successfully created certificates
2018/03/15 04:39:37 Serving securely on HTTPS port: 8443
Starting the Proxy
Now I can start up the kubectl proxy. If I specify the IP address of the dashboard like so:
[root@admins73603 ~]# kubectl proxy --address 192.168.73.27
Starting to serve on 192.168.73.27:8001
I’ll receive a 403 Forbidden when accessing the dashboard. I didn’t look into this, but decided to run kubectl proxy with no options:
[root@admins73603 ~]# kubectl proxy
Starting to serve on 127.0.0.1:8001
Now from the same machine I can hit the dashboard:
[root@admins73603 ~]# curl localhost:8001
{
 "paths": [
 "/api",
 "/api/v1",
 "/apis",
 "/apis/",
 "/apis/admissionregistration.k8s.io",
...
However, I want to be able to hit it remotely with my desktop’s web browser. Using putty I created an ssh tunnel to map my local 8001 port to port 8001 on my master node admins73603.

Boom:
Uh. I tried plugging in my kubeadm config but it said the required info was missing.
Creating a Dashboard Account
If you read this it says that certificate-based auth isn’t supported at this time and this is what kubeadm’s config is configured with. So I created a sample user:
apiVersion: v1
kind: ServiceAccount
metadata:
  name: admin-user
  namespace: kube-system
kubectl create -f dashboard-user.yaml
Made the user a cluster-admin:
apiVersion: rbac.authorization.k8s.io/v1beta1
kind: ClusterRoleBinding
metadata:
  name: admin-user
roleRef:
  apiGroup: rbac.authorization.k8s.io
  kind: ClusterRole
  name: cluster-admin
subjects:
- kind: ServiceAccount
  name: admin-user
  namespace: kube-system
kubectl create -f admin-user-binding.yaml
Retrieved the token:
[root@admins73603 ~]# kubectl -n kube-system describe secret $(kubectl -n kube-system get secret | grep admin-user | awk '{print $1}')
Name: admin-user-token-wplqr
Namespace: kube-system
Labels:
Annotations: kubernetes.io/service-account.name=admin-user
 kubernetes.io/service-account.uid=91592a2a-2805-11e8-9b83-005056851a80

Type: kubernetes.io/service-account-token

Data
====
ca.crt: 1025 bytes
namespace: 11 bytes
token: eyJhbGciOiJSUzI1NiIsInR5cCI6IkpXVCJ9.eyJpc3MiOiJrdWJlcm5ldGVzL3NlcnZpY2VhY2NvdW50Iiwia3ViZXJuZXRlcy5pby9zZXJ2aWNlYWNjb3VudC9uYW1lc3BhY2UiOiJrdWJlLXN5c3RlbSIsImt1YmVybmV0ZXMuaW8vc2VydmljZWFjY291bnQvc2VjcmV0Lm5hbWUiOiJhZG1pbi11c2VyLXRva2VuLXdwbHFyIiwia3ViZXJuZXRlcy5pby9zZXJ2aWNlYWNjb3VudC9zZXJ2aWNlLWFjY291bnQubmFtZSI6ImFkbWluLXVzZXIiLCJrdWJlcm5ldGVzLmlvL3NlcnZpY2VhY2NvdW50L3NlcnZpY2UtYWNjb3VudC51aWQiOiI5MTU5MmEyYS0yODA1LTExZTgtOWI4My0wMDUwNTY4NTFhODAiLCJzdWIiOiJzeXN0ZW06c2VydmljZWFjY291bnQ6a3ViZS1zeXN0ZW06YWRtaW4tdXNlciJ9.4B1OeS_tOiSKaGec4aeFezKghYhvva7IlZuwRy0PfqsQcLVoXF7kErmMCvNIPrmlqZM9Y73csOYUtIRnejhdQE9Lo0FA2EUEju9bSmxo8mX_TsWMdHdwXF4-e7zlKfn3vDVU7iaPCwwPOf8fpQUygc38tyaJROEtdFR10aIp5SddUwzLzxmHDCsNQIhX_lpF5I9-5ONwtzd7318aAW0q98uifV8kyqFHFnxt-kKYzvgw1FUs9lTLlZDuC5q13Db5FnBjHQxrZ3bimduTo24BO3kbQ5gShpGz8FUuivAyRRidacVYa5tfV0naoTyaAcq5fCZDvJ0b-55Le86NY-zIGA
Pasted the token in:
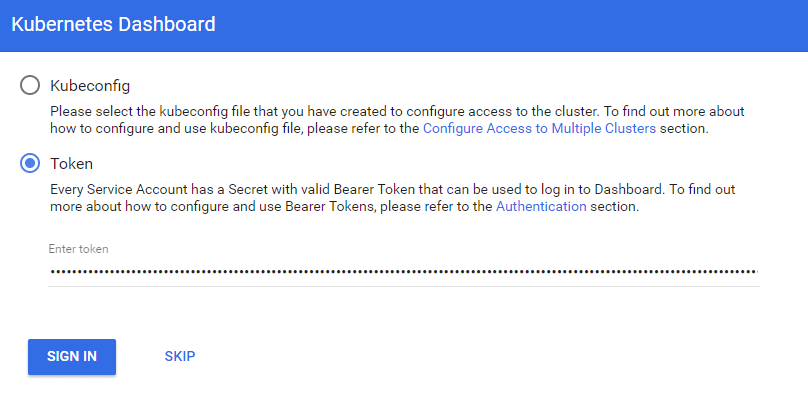
and was finally able to access the dashboard:

